How to open a GraphPad Prism file without Prism (.prism and .pzfx, tested on 27 files)
Open a GraphPad .prism or .pzfx file free without Prism: read the data tables and fit results in your browser and export to Excel. Tested on 27 real files.
A lab mate, a co-author or a CRO sends you their results as a .prism or .pzfx file. You do not have GraphPad Prism, or your licence ran out, and all you need is the numbers: the replicate values, the IC50, the P value from the survival curve.
Here is what is inside those files, your free and paid ways to open them, and what happened when we ran 27 real Prism files through our Prism File Viewer.
The three Prism file types
| Extension | Saved by | What is inside |
|---|---|---|
| .prism | Prism 10 and later | A zip style package. Data tables are stored as CSV files, analysis settings and results as JSON |
| .pzfx | Prism 5 to 9 | XML. Data tables and info sheets are readable text; analyses and graphs sit in a compressed block only Prism reads |
| .pzf | Older Prism versions | A binary format. You need Prism to open it |
GraphPad says Prism 10 opens the older .pzfx and .pzf files in Compatibility Mode. Because .prism is an open package, you can even unzip a copy with any zip tool and find the data as CSV, but the folders have long ID names and you have to match them up yourself.
Your options
| Option | Cost | Runs on | Catch |
|---|---|---|---|
| GraphPad Prism 11 | Personal licence from US$260 a year (Standard) or US$360 (Pro) | Windows 10 or 11 (64-bit), macOS 12 or later | Paid; checks the licence online at least once every 30 days |
| Prism in Viewer Mode | Free, in the normal Prism installer (Prism 10 and later) | Same as Prism | View and print only. No editing, no copying text to the clipboard, no exporting sheets |
| The pzfx package for R | Free (MIT licence), version 0.3.1 | Anywhere R runs | Reads .pzfx tables into R; you need to know R |
| TaskNinja Prism File Viewer | Free | Any current browser, including phones | Graphs are listed by name, not drawn; .pzf is not supported |
If you need to see the graphs exactly as the author made them, install Prism and pick Use Prism in Viewer Mode when it starts. GraphPad notes that Prism also drops into Viewer Mode by itself when a licence expires, so an old install can still open your files. The catch is that Viewer Mode will not let you copy or export the numbers. If the numbers are what you want, in Excel, a browser viewer is quicker.
How to open a Prism file in your browser
- Open Prism File Viewer and press Choose a Prism file, or drop the .prism or .pzfx file on the box. No file at hand? Press Open a sample Prism project.
- The heading tells you what is in the project: data tables, analyses with their result tables, and graphs.
- Use the Sheet list to pick a data table, a result table such as Table of results, or an info sheet. Wide tables page with Next columns; long ones have Show all rows.
- Under each data table you get the n, mean, SD and SEM for every data set, worked out from all rows and replicates, with values excluded in Prism left out.
- Save what you need: Download Excel (all tables) puts every table on its own sheet, Download CSV and Copy table take the table on screen, and Copy summary copies a short description of the project.
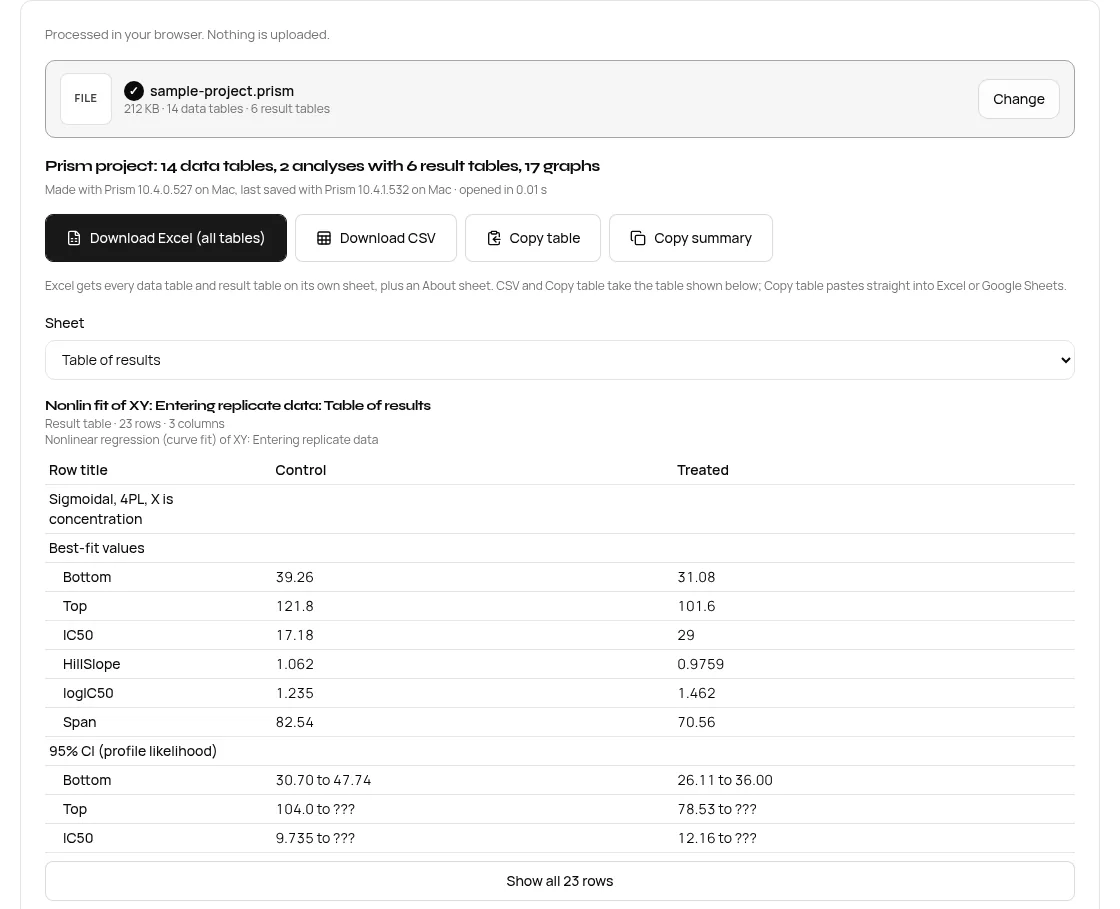
If you only want a spreadsheet, Prism to Excel is the same tool with the Excel step up front.
What we tested
We used two sets of openly licensed test files: the example projects from the pRism R package (MIT), saved by Prism 10.4 on a Mac, and 23 .pzfx files from the pzfx R package (MIT), saved by Prism 6, 7 and 8. Timings are from choosing the file to the table on screen, on the live site in desktop Chrome.
| File | Saved by | Size | What opened | Time |
|---|---|---|---|---|
| demo_dataset.prism | Prism 10.4.0 | 212 KB | 14 data tables, 2 analyses with 6 result tables, 17 graphs listed | 0.13 s |
| demo_dataset.pzfx (same project) | Prism 10.4.0 | 127 KB | The same 14 data tables; analyses and graphs are in the compressed block | 0.07 s |
| no_analysis.prism | Prism 10.4.1 | 31 KB | 2 data tables, 2,000 values, 2 graphs listed | 0.07 s |
| 23 pzfx package files | Prism 6.0f to 8.0.1 | 5 to 16 KB | All 23 opened | 0.06 to 0.07 s (5 timed on the live site) |
| empty.prism | Prism 10 | 194 bytes | Refused with a clear message: the package has no sheets | 0.05 s |
Opening is only half the test. The pzfx package ships the expected table for 21 of its files, so we compared every cell our code reads against them. All 666 cells matched.
| Test file | Table type | Cells matched |
|---|---|---|
| column_hugetable | Column, 53 replicates | 159 of 159 |
| survival | Survival | 135 of 135 |
| x_date | XY with dates as X | 100 of 100 |
| x_y_with_strike | XY with 3 values excluded in Prism | 24 of 24 |
| column_sdn | Column, entered as mean, SD and N | 18 of 18 |
| column_upper-lower-limits | Column, mean with upper and lower limits | 18 of 18 |
| contingency | Contingency | 6 of 6 |
| parts_of_whole | Parts of whole | 8 of 8 |
| All 21 files | XY, Column, Grouped, Contingency, Survival, Parts of whole | 666 of 666 |
Values that were excluded in Prism are marked with an asterisk in the table and left out of the summary statistics, which is how Prism treats them too.
Reading results without rerunning anything
A .prism file keeps the results Prism worked out, so you can read them even though the viewer does no curve fitting of its own. In the sample project, the dose response fit gives an IC50 of 17.18 for Control and 29 for Treated, with the 95% profile likelihood interval for Control's IC50 shown as 9.735 to ???. The question marks are Prism's own way of saying the upper limit could not be found, and the viewer shows them as saved.
The survival analysis in the same file reports a log rank (Mantel Cox) chi square of 2.01 with P = 0.1563, a Gehan Breslow Wilcoxon P of 0.1115, and median survival of 75 for the treated group (Undefined for control). Every one of those tables goes into the Excel file.
What the viewer does not do
- Graphs are not drawn. Prism's graph and layout formatting is its own, so graphs are listed by name. Ask the sender for a PDF or PNG of the figure.
- No analysis results from .pzfx. In a .pzfx file they are in the compressed block. Ask for the .prism file, or open it in Prism Viewer Mode.
- No .pzf files. That binary format needs Prism.
- No editing or new analyses. It reads and exports; it does not rerun a fit or save back to Prism.
Is the file uploaded?
No. The file is read by code running in your browser tab, and the Excel and CSV files are made on your device. We watched the network while opening all nine test files on 26 Oct 2026: none of the requests carried the file. The only traffic was an occasional quality check ping from Google's ad script. Unpublished data deserves that care.
FAQ
Can I open a .prism file without GraphPad Prism?
Yes. Choose it in our Prism File Viewer to see the data tables and saved results in any browser. To see the graphs, install Prism and use the free Viewer Mode.
Is there a free Prism viewer?
GraphPad's Viewer Mode is free and comes with the Prism 10 and later installer. It shows data, graphs and results, but it cannot copy text or export sheets.
How do I convert a Prism file to Excel?
Open it in Prism to Excel and press Download Excel (all tables). Each data table and result table gets its own sheet, plus an About sheet.
What is the difference between .prism and .pzfx?
.prism is the Prism 10 format, a package of CSV and JSON files. .pzfx is the older XML format; its data tables are readable, but analyses and graphs are compressed for Prism only.
Why will my Prism file not open?
It may be an old binary .pzf, or an empty or damaged project. Ask the sender to save it again from a current version of Prism as a .prism file.
Sources
- The PRISM file format, GraphPad Prism 11 User Guide
- Where can I find the free Prism Viewer? GraphPad FAQ 788
- How to buy Prism, GraphPad (prices)
- System requirements, GraphPad Prism 11 User Guide and Prism release notes
- pzfx: Read and Write GraphPad Prism Files, CRAN
- Test files: pRism by Biomiha (GitHub, MIT) and pzfx by Yue Jiang (GitHub, MIT).
Sources checked 26 Oct 2026. Counts, values and timings are from the live tool and our test run on that date; button labels are from the live page.
Written by the TaskNinja team with help from an AI writing tool, then checked against GraphPad's documentation and the tool itself.