BMI chart for children in India by age: IAP and WHO cut-offs for boys and girls (5 to 18)
Normal BMI for Indian children aged 5 to 18, year by year for boys and girls, on the IAP 2015 and WHO charts, with worked examples and a free calculator.
Your child's school health card says BMI 17.6 and you want to know if that is fine. For an adult, 17.6 would be underweight. For a 9 year old boy it can be overweight. Children are never judged on the adult lines of 18.5, 23 or 25. Their BMI is read against other children of the same age and sex.
Below are the year by year cut-offs for Indian boys and girls from 5 to 18, on the two charts Indian paediatricians use: the 2015 Indian Academy of Pediatrics (IAP) chart and the WHO growth reference. Every number comes from the tables in our BMI calculator for kids and teens, which reads the published IAP and WHO data.
Step 1: work out the BMI
BMI is weight in kilograms divided by height in metres, squared. A boy who is 135 cm and 32 kg has a BMI of 32 / (1.35 x 1.35) = 17.6. The calculator does this for you and also takes feet and inches or pounds.
Measure height without shoes, standing straight against a wall, and weight in light clothes. A 2 cm error in height moves a child's BMI by about 0.5, which is enough to cross a line.
Step 2: pick the chart
| Point | IAP 2015 chart | WHO 2007 reference |
|---|---|---|
| Ages | 5 to 18 years | 5 to 19 years |
| Built from | 33,148 urban Indian children, 14 cities | Children from several countries |
| Overweight | From the line that joins adult BMI 23 | Above +1 SD (84th percentile) |
| Obesity | From the line that joins adult BMI 27 | Above +2 SD (98th percentile) |
| Thin | Below the 3rd centile | Below -2 SD (severe below -3 SD) |
| Under 5 years | IAP says use the WHO standards | WHO weight-for-height standards |
The IAP made its own chart because Indian children carry more body fat at the same BMI, and the adult Indian lines of 23 and 27 are lower than the WHO's 25 and 30. So the IAP lines sit a little lower than the WHO ones at most ages. That is why a child can be overweight on the IAP chart and still normal on WHO.
BMI chart for boys, 5 to 18
| Age | IAP overweight from | IAP obesity from | WHO normal range | WHO obesity above |
|---|---|---|---|---|
| 5 | 15.7 | 17.5 | 12.9 to 16.6 | 18.3 |
| 6 | 16.0 | 17.8 | 13.0 to 16.8 | 18.5 |
| 7 | 16.3 | 18.2 | 13.1 to 17.0 | 19.0 |
| 8 | 16.7 | 18.8 | 13.3 to 17.4 | 19.7 |
| 9 | 17.3 | 19.6 | 13.5 to 17.9 | 20.5 |
| 10 | 18.0 | 20.5 | 13.7 to 18.5 | 21.4 |
| 11 | 18.7 | 21.5 | 14.1 to 19.2 | 22.5 |
| 12 | 19.5 | 22.6 | 14.5 to 19.9 | 23.6 |
| 13 | 20.2 | 23.4 | 14.9 to 20.8 | 24.8 |
| 14 | 20.8 | 24.2 | 15.5 to 21.8 | 25.9 |
| 15 | 21.4 | 24.9 | 16.0 to 22.7 | 27.0 |
| 16 | 22.0 | 25.5 | 16.5 to 23.5 | 27.9 |
| 17 | 22.6 | 26.0 | 16.9 to 24.3 | 28.6 |
| 18 | 23.2 | 26.6 | 17.3 to 24.9 | 29.2 |
BMI chart for girls, 5 to 18
| Age | IAP overweight from | IAP obesity from | WHO normal range | WHO obesity above |
|---|---|---|---|---|
| 5 | 15.5 | 18.0 | 12.7 to 16.9 | 18.8 |
| 6 | 15.9 | 18.6 | 12.7 to 17.0 | 19.2 |
| 7 | 16.4 | 19.3 | 12.7 to 17.3 | 19.8 |
| 8 | 16.9 | 20.1 | 12.9 to 17.7 | 20.6 |
| 9 | 17.6 | 21.0 | 13.1 to 18.3 | 21.5 |
| 10 | 18.4 | 21.9 | 13.5 to 19.0 | 22.6 |
| 11 | 19.3 | 23.0 | 13.9 to 19.9 | 23.7 |
| 12 | 20.2 | 24.1 | 14.4 to 20.8 | 25.0 |
| 13 | 21.1 | 25.2 | 14.9 to 21.8 | 26.2 |
| 14 | 21.8 | 25.9 | 15.4 to 22.7 | 27.3 |
| 15 | 22.3 | 26.3 | 15.9 to 23.5 | 28.2 |
| 16 | 22.6 | 26.5 | 16.2 to 24.1 | 28.9 |
| 17 | 22.9 | 26.7 | 16.4 to 24.5 | 29.3 |
| 18 | 23.2 | 26.8 | 16.4 to 24.8 | 29.5 |
These are values at the exact birthday. A child of 9 years and 6 months sits half way between the 9 and 10 rows, and the lines rise every month, so for anything close to a line use the calculator with the months filled in rather than reading the table by eye.
Three worked examples
We ran these on the live calculator on 27 Oct 2026.
| Child | BMI | IAP 2015 chart | WHO chart |
|---|---|---|---|
| Boy, 9 yrs, 135 cm, 32 kg | 17.6 | Overweight (from 17.3) | Normal, 80th percentile |
| Girl, 12 yrs, 150 cm, 38 kg | 16.9 | Not overweight (25th to 50th) | Normal, 31st percentile |
| Boy, 14 yrs, 160 cm, 58 kg | 22.7 | Overweight (from 20.8) | Overweight, 90th percentile |
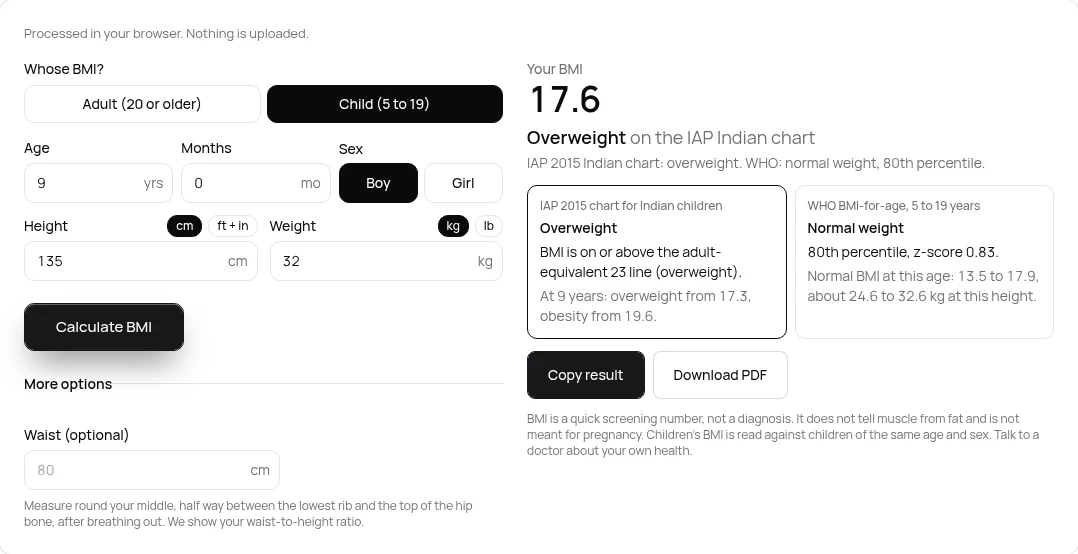
The 9 year old boy is the interesting one. He is just over the IAP overweight line but inside the WHO normal range, which ends at 17.9 for his age. At 135 cm, the WHO normal range works out to about 24.6 to 32.6 kg, so he is at the very top of it. This is not a reason to put a child on a diet. It is a reason to keep an eye on the trend and mention it at the next paediatrician visit.
How to use the calculator
- Open the BMI calculator for kids and teens. Child (5 to 19) is already picked.
- Type the age in years and months. If you only know the date of birth, the age calculator gives you the exact years and months.
- Tap Boy or Girl, then type the height (cm, or ft + in) and the weight (kg or lb).
- Press Calculate BMI. The big number is the BMI. Below it, one card gives the IAP reading and the other the WHO percentile, z-score and normal range for the child's age and height.
- Press Copy result or Download PDF to keep a record or show your doctor.
For anyone 19 or older, tap Adult (20 or older) or use the adult BMI calculator, which uses the Indian adult lines.
What the calculator does not do
- No children under 5. For toddlers, doctors use the WHO Child Growth Standards and weight-for-height, which this page does not cover.
- No growth curve. It reads one measurement and does not save a history or plot your child's line over the years. Write the numbers down each time, or keep the PDFs.
- No height-for-age or weight-for-age. It will not tell you whether a child is short for their age. The IAP has separate height and weight charts for that.
- No diagnosis. BMI does not tell muscle from fat, and a sporty child can read high. The IAP chart was built from urban upper and middle income families, so it fits some children better than others.
Are the numbers sent anywhere?
No. The BMI and both chart readings are worked out in your browser tab. While taking the screenshot we watched the network: pressing Calculate BMI sent nothing with the age, height or weight. The only request was a routine ping from Google's ad script.
FAQ
What is a normal BMI for a 10 year old in India?
On the IAP chart, overweight starts at 18.0 for a boy and 18.4 for a girl at exactly 10 years. On the WHO chart the normal range is 13.7 to 18.5 for boys and 13.5 to 19.0 for girls.
Can I use the adult BMI chart for my child?
No. Adult lines such as 18.5, 23 and 25 do not apply under 19. A healthy 8 year old often has a BMI of 15 to 16, which the adult chart would wrongly call underweight.
Which chart should I follow, IAP or WHO?
The IAP recommends its 2015 chart for Indian children aged 5 to 18. Many schools and government programmes use WHO. When they disagree, the child is usually close to a line, so ask your paediatrician and watch the trend.
My child is below the 3rd centile. Is that a problem?
It means the BMI is lower than 97 out of 100 children of the same age and sex in the IAP data. Some children are simply lean, but a low or falling BMI is worth a doctor's check.
Is BMI accurate for teenagers?
It is a fair screening number, but puberty starts at different ages. Two 13 year olds of the same BMI can be at very different stages, so one reading should never decide anything on its own.
Sources
- Khadilkar V et al., Revised IAP growth charts for height, weight and BMI for 5 to 18 year old Indian children, Indian Pediatrics 2015;52:47-55 (PDF)
- WHO Growth Reference 5 to 19 years, BMI-for-age tables
- WHO fact sheet, Obesity and overweight (definitions for 5 to 19 years and under 5)
- WHO Child Growth Standards, birth to 5 years
Sources checked 27 Oct 2026. Every number in the tables comes from our calculator's code on that date. General information, not medical advice.
Written by the TaskNinja team with help from an AI writing tool, then checked against the IAP and WHO sources above and the tool itself.